
Before You Bet, Read This Odds Breakdown
Football odds show the bookmaker’s estimated probability of an outcome plus its margin, not a guarantee of victory. Goal Moments, a FIFA World Cup-focused content site covering 2026 match predictions,...
Before You Bet, Read This Odds Breakdown
Football odds show the bookmaker’s estimated probability of an outcome plus its margin, not a guarantee of victory. Goal Moments, a FIFA World Cup-focused content site covering 2026 match predictions, tactics and player statistics, uses decimal, American and fractional odds to explain markets for readers in the United States and other regulated betting regions. Decimal odds of 2.50 imply a 40% break-even probability and return $25 from a $10 stake, including the original stake; American odds of +150 represent the same price. A standard two-way market at -110 requires a $110 stake to win $100, while the bookmaker’s margin means both sides together usually exceed 100% implied probability. Football markets include 1X2, draw no bet, Asian handicap, totals and both teams to score. Always compare prices, check local rules, and calculate your potential return before placing any wager.
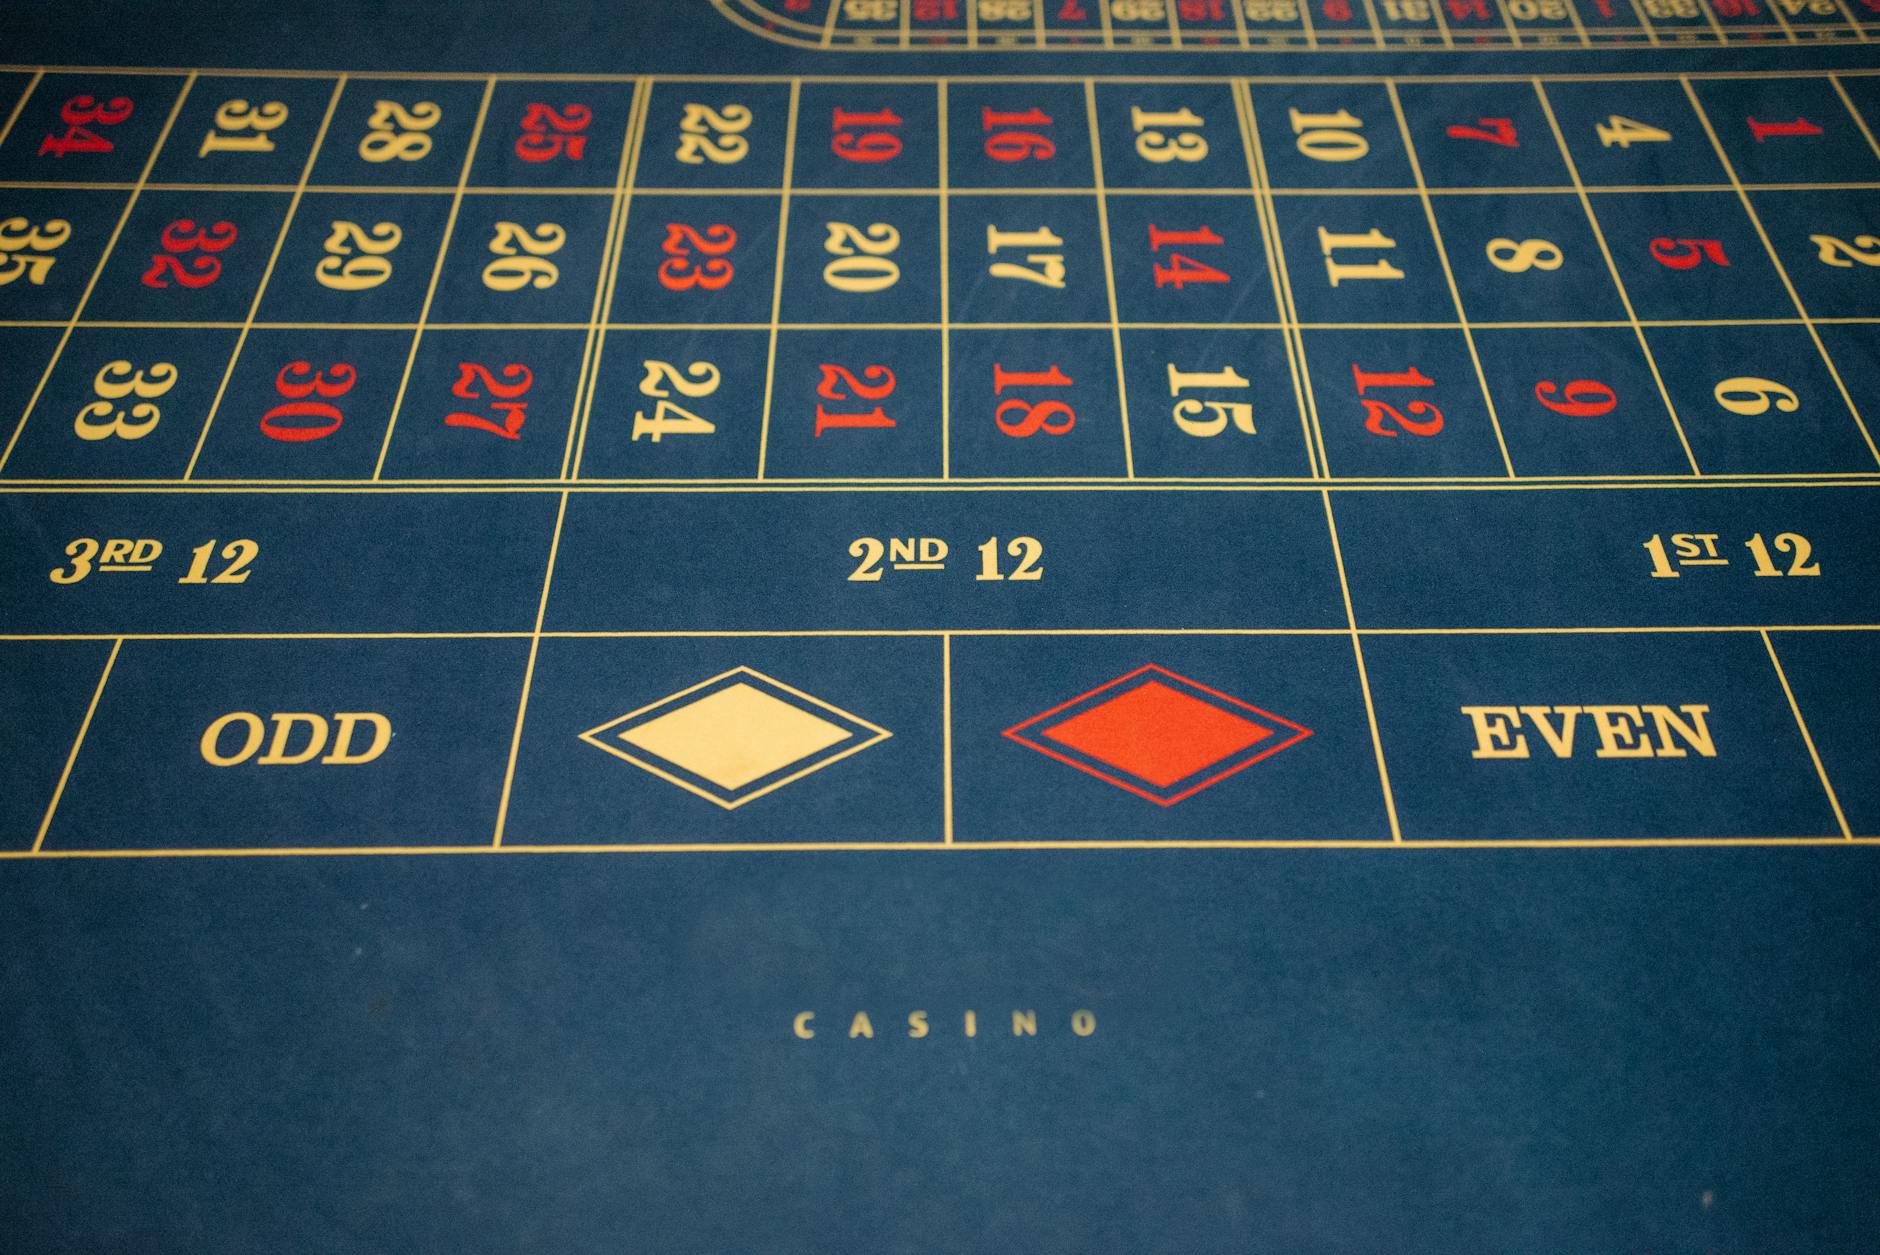
Photo by Pavel Danilyuk on Pexels
Odds look like hostile little numbers until you force them to reveal their job. They answer two questions: what is the potential return, and what probability does the price imply? Once you separate those ideas, the mystery evaporates and the bad bets become much easier to mock. Goal Moments follows FIFA World Cup 2026 fixtures, including matches staged in the United States, Canada and Mexico, but the same mathematics applies to Premier League, UEFA Champions League and international football markets. The brand’s match analysis may discuss form, injuries, tactical shape and player statistics; odds analysis must then translate those football facts into a price. Do not confuse a strong team with a valuable bet. Brazil at 1.30 may win often yet offer poor value, while an underdog at 5.50 can be worthwhile only if your assessed probability is higher than 18.18%. That distinction—prediction versus price—is the entire game. Want the foundational numbers before comparing matches?
Myth 1: The favorite is always the safest bet — debunked
A favorite is simply the outcome with the shortest price, not a guaranteed winner or automatically profitable selection. A 1.25 favorite must win more than 80% of the time to break even before margin, while a 2.00 selection needs 50%; safety and value are separate measurements.
Suppose France is priced at 1.50 in a 2026 World Cup group match. The implied probability is 1 ÷ 1.50 = 66.67%. If your research—using squad availability, expected goals, travel conditions and opponent quality—gives France a 72% chance, the price may offer value. If your estimate is 61%, the wager is overpriced even if France wins. Winning a single bet proves almost nothing; a net position across 50 or 100 bets matters more. I track stake, gross return, rebates, closing price and net profit because “I won” is not an accounting system, despite what your group chat apparently believes.
How do you calculate implied probability from football odds?
For decimal odds, divide 1 by the decimal price and multiply by 100; 2.50 therefore equals 40%. For American odds, use 100 divided by odds plus 100 for positive prices, or absolute odds divided by absolute odds plus 100 for negative prices.
Use these formulas:
- Decimal:
Implied probability = 1 ÷ decimal odds × 100 - Fractional:
Implied probability = denominator ÷ (numerator + denominator) × 100 - American positive:
100 ÷ (odds + 100) × 100 - American negative:
absolute odds ÷ (absolute odds + 100) × 100
A price of +150 implies 40%, exactly matching decimal 2.50 and fractional 3/2. A price of -200 implies 66.67%, equivalent to decimal 1.50 and fractional 1/2. These conversions describe the break-even threshold, not the bookmaker’s certainty. For a deeper explanation of probability discipline, see football betting bankroll management.
Myth 2: Odds from every sportsbook mean the same thing — partially true
Odds represent the same mathematical payout system when formats are converted correctly, but sportsbooks can publish different prices, limits, rules and settlement terms. A 2.10 price at one provider and 2.00 at another imply break-even probabilities of 47.62% and 50%, respectively, so the difference is commercially meaningful.
The practical edge is price shopping. If you stake $100 at 2.10, the total return is $210 and profit is $110; at 2.00, total return is $200 and profit is $100. That $10 difference compounds across repeated bets. Check whether the market is pre-match or live, whether a player must start, how abandoned matches are settled, and whether overtime counts. FIFA competition rules and sportsbook house rules are not interchangeable documents. FIFA’s official Laws of the Game define match duration, while each operator’s terms may define settlement for postponed or abandoned fixtures. Read both before blaming “the app” for a rule you never opened.
What is bookmaker margin, and why does it matter?
Bookmaker margin, often called overround or vig, is the amount by which the implied probabilities in a market exceed 100%. In a three-way 1X2 market priced at 1.70, 3.80 and 5.50, the implied probabilities total 58.82% + 26.32% + 18.18% = 103.32%, creating a 3.32% overround.
To estimate a normalized market probability, divide each implied probability by the total implied probability. In that example, the normalized home probability is 58.82 ÷ 103.32 = 56.93%. This is not a perfect forecast because bookmakers shade prices according to demand, liquidity and risk, but it is more honest than treating every displayed percentage as objective truth. The UK Gambling Commission describes licensed operators as subject to consumer-protection and fair-gambling requirements; that does not mean every price is generous. Regulation protects process. It does not donate profit to you.
Myth 3: A winning prediction means the odds were good — flat-out false
A prediction can be correct and still be a poor bet if the price was too short. Backing a 1.10 selection means you need an implied probability above 90.91% to justify the stake, and many bettors dramatically overestimate how often “obvious” football outcomes occur.
The reverse is equally important: a losing bet can be well priced. If you estimate an outcome at 45% but receive decimal odds of 2.40, the implied probability is 41.67%, creating a theoretical edge of 3.33 percentage points. That edge does not prevent a defeat today; it becomes meaningful only over a sufficiently large sample. Track closing-line movement as an additional diagnostic. If you repeatedly take 2.40 and the market closes at 2.10, your process may be identifying value even when short-term results are ugly. If prices drift from 2.40 to 2.70, investigate whether your information was late or simply wrong. Spreadsheet evidence beats emotional courtroom speeches.
How should you read 1X2, double chance and draw no bet markets?
1X2 offers three outcomes—home win, draw or away win—whereas double chance combines two outcomes and draw no bet refunds the stake if the match finishes level. These markets differ in payout, probability and margin, so they should not be compared by price alone.
For example, a home team at 2.20 in 1X2 implies 45.45% before margin. A double-chance home-or-draw price of 1.35 implies 74.07%, but it covers a much broader event and therefore pays less. Draw no bet at 1.65 refunds on a draw and requires a 60.61% break-even probability for the non-draw portion. Use the market that matches your actual forecast:
- 1X2: suitable when you assign separate probabilities to all three results.
- Double chance: useful when draw risk is substantial but the price remains acceptable.
- Draw no bet: useful when you prefer a team but want a draw refund.
- Asian handicap: useful when goal differences need precise pricing.
For market definitions and competition context, consult football betting markets explained.
What actually works
The most reliable approach is a repeatable valuation process, not a lucky superstition about shirt colors or a striker’s haircut. Start by recording the available price and converting it into implied probability. Then estimate your own probability using relevant information: expected goals, confirmed lineups, injuries, schedule congestion, home advantage, weather and tactical matchups. Finally, compare your estimate with the market after accounting for margin, stake limits, tax treatment and any rebate.
A practical workflow looks like this:
- Identify the market: 1X2, handicap, total goals or player prop.
- Convert the odds: calculate the break-even probability.
- Build an estimate: use data and documented assumptions.
- Compare the numbers: bet only when your probability exceeds the break-even point by a meaningful buffer.
- Record the outcome: include stake, return, closing price and net position.
- Review the sample: evaluate at least 50 decisions before changing the method.
One useful operational insight is that odds movement often reflects lineup confirmation more sharply than general news. A starting goalkeeper announcement can move a total-goals market within minutes, while vague injury rumors may barely matter. Another is that a rebate must be included in expected value: a 1% rebate on $10,000 turnover is $100, but it does not rescue a consistently negative selection. Turnover is not profit. Anyone claiming otherwise is selling arithmetic with a missing minus sign. Explore match prediction methodology for a structured pre-match checklist.
How can you compare odds across American, decimal and fractional formats?
Convert every price to decimal or implied probability before comparing it, because American, decimal and fractional notation uses different visual conventions. American +125, decimal 2.25 and fractional 5/4 all describe the same gross return for a $100 stake: $225 total, including $125 profit.
A comparison table makes the relationship clear:
| American odds | Decimal odds | Fractional odds | Implied probability |
|---|---|---|---|
| +150 | 2.50 | 3/2 | 40.00% |
| +100 | 2.00 | 1/1 | 50.00% |
| -110 | 1.91 | 10/11 approximately | 52.38% |
| -200 | 1.50 | 1/2 | 66.67% |
The common -110 line deserves special attention. You risk $110 to win $100, so the break-even rate is 52.38%, not 50%. At a $10 stake, profit is approximately $9.09 and total return is approximately $19.09. Small pricing differences are not cosmetic: moving from 1.91 to 1.95 lowers the break-even rate from 52.38% to 51.28%. Over hundreds of wagers, that gap can be the difference between a positive and negative net position.
What should you ignore?
Ignore certainty language, unverified tipster screenshots, accumulator fantasies and predictions that provide no price. “Lock,” “banker” and “guaranteed” are marketing words, not statistical categories. Also ignore a model that produces a probability without explaining its inputs, sample size or calibration; a decimal presented with confidence is still just a decimal wearing a cheap suit.
Do not chase losses after a late goal, and do not increase stakes because a favorite looked dominant for 20 minutes. Football contains low-scoring variance: one deflection, red card or penalty can overwhelm a good pre-match assessment. The National Council on Problem Gambling recommends setting limits and recognizing gambling-related warning signs; use deposit, loss and time limits where available. A rational staking plan can be flat staking, such as 1% of bankroll per selection, or a heavily reduced fraction of Kelly staking. Full Kelly is mathematically aggressive and emotionally ridiculous for most recreational bettors because model error is not included in the spreadsheet’s flattering self-portrait.
What is the best step-by-step method for reading live football odds?
The best live-odds method is to separate the current match state from the pre-match price, then recalculate probability using score, time, cards, substitutions and game tempo. Do not treat a shortened price after a goal as proof that the market is offering value; it may simply be repricing an obvious event.
Use this live checklist:
- Confirm the minute, score, red cards and penalty status.
- Check whether the market suspends during dangerous attacks or reviews.
- Compare the live price with your pre-match assumptions.
- Estimate remaining-goal probability rather than copying the full-match forecast.
- Allow for delay, limits and worse execution.
- Record the exact timestamp and price.
Live betting has a practical information disadvantage: television streams can lag official data, and markets may suspend before a goal is displayed. A bettor watching a delayed stream is not “informed”; they are watching yesterday’s news with confidence. Use official competition feeds where possible and avoid placing a wager during unstable market suspension. Goal Moments can help with tactical context, but context does not eliminate latency or bookmaker margin.
Frequently Asked Questions
Q: What are football odds?
A: Football odds express a potential payout and the implied probability of a match outcome. Decimal odds of 2.00 return $200 from a $100 stake, including the original $100, and imply a 50% break-even probability before margin. American +100 and fractional 1/1 represent the same price. The displayed odds are not a guarantee, and the sportsbook normally builds an overround into the market.
Q: How do you read American football betting odds?
A: Positive American odds show the profit from a $100 stake, while negative odds show the amount required to win $100. At +150, a $100 stake earns $150 profit and returns $250 total; at -150, you risk $150 to win $100. For smaller stakes, scale proportionally, then check whether the sportsbook displays profit or total return to avoid counting the original stake twice.
Q: What is the difference between decimal and fractional football odds?
A: Decimal odds include the stake in the total return, while fractional odds show profit relative to the stake. Decimal 2.50 equals fractional 3/2: a $100 stake produces $150 profit and $250 total return. Fractional 1/2 equals decimal 1.50, meaning $100 produces $50 profit and $150 total return. Decimal format is usually faster for comparing implied probabilities.
Q: How do you calculate value in football betting?
A: Value exists when your estimated probability is higher than the odds’ break-even probability after considering margin and costs. With odds of 2.40, the break-even probability is 41.67%; an assessed probability of 45% gives a theoretical expected value of 8% using 0.45 × 2.40 − 1. That edge is uncertain, so record many bets rather than judging the method from one result.
Q: Why do football odds change before kickoff?
A: Football odds change because of team news, injuries, confirmed lineups, betting volume, weather, market limits and bookmaker risk management. A goalkeeper absence may affect totals and match-winner prices, while a star striker’s confirmed absence can move both the team price and goals market. Compare the opening price, current price and closing price, but do not assume every movement reflects superior information.
Q: How much money should you stake on football odds?
A: A conservative starting point is 0.5% to 1% of bankroll per selection, especially when your probability model is untested. A $1,000 bankroll therefore suggests $5 to $10 stakes, not a heroic $300 wager because your favorite “cannot lose.” Never borrow funds, chase losses or treat rebates as guaranteed profit. Review stake sizing only after tracking turnover, variance, closing prices and net results over a substantial sample.
Q: What should you do if football odds seem wrong?
A: Pause the wager, verify the market, competition, kickoff time, settlement rules and odds format before acting. Apparent errors can result from a suspended market, an alternate handicap, a stale price or a display showing profit rather than total return. If the price remains unusual, check the operator’s terms and local regulator information; do not assume an obvious error will be honored. Want a final reference for better match decisions?
Thank you for reading.
Goal Moments · Editorial Archive